5.1 The data shown below represents the Grade 10 Mathematical Literacy test percentages for
learners from Masiqinise Secondary School.
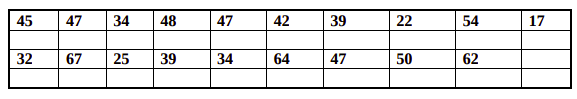
5.1.1 Arrange the values in ascending order. (2)
5.1.2 Refer to the data shown above and determine the median. (2)
5.1.3 Determine the mode of the data represented above. (2)
5.1.4 Show by calculation that the range is 50%. (2)
5.1.5 Calculate the average percentage of this Grade 10 class. (3)
5.1.6 Based on the data represented above, determine the probability that a learner
from this class has a percentage less than 30% in the test. Write your answer
to the nearest percentage. (4)
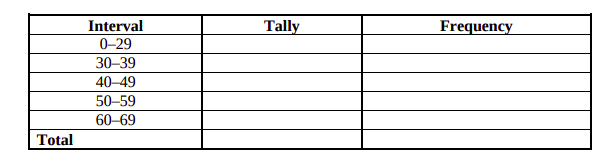
5.2 Complete the frequency table for the Mathematical Literacy test percentages shown
above in QUESTION 5.1. Use the table drawn in ANSWER SHEET 1 to answer this
question.
(3)
[20]
TOTAL: 75