Table 3 below compares prices of selected food items in the rural and urban areas for January 2015. Study the table and answer the questions that follow:
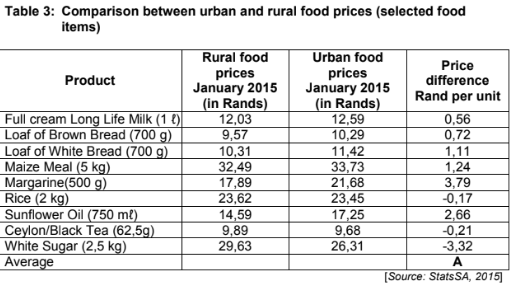
4.1 Arrange the rural food prices in descending order. (2)
4.2 Determine the median for rural food prices. (2)
4.3 Calculate the range for urban food prices. (3)
4.4 Identify the minimum price difference in rand per unit. (2)
4.5 Identify ONE product with the largest price difference between Urban and Rural area. (2)
4.6 Identify the mode for urban food prices. (2)
4.7 Draw a bar graph to show the last FIVE products from urban food prices. Use the graph paper provided on ANSWER SHEET 1. (6)
4.8 Write down your observation about the food prices for both urban and rural customers. (2)
4.9 Calculate the value of A, the average price difference in rand per unit. (3)
4.10 Determine the probability that a product randomly selected has a mass of 700 g. Give your answer to the nearest percentage. (3)
[27]