
5.1.1 Write down the total loss, in rand, caused by fire during 2011. (2)
5.1.2 Calculate the mean total loss, in rand, caused by fires for the period 2010 to 2015. (3)
5.1.3 Identify the maximum number of fires for the period 2010 to 2015. (2)
5.1.4. Calculate the value of A, the fire loss as a percentage of the GNI for 2013. Round your answer to TWO decimal places. (4)
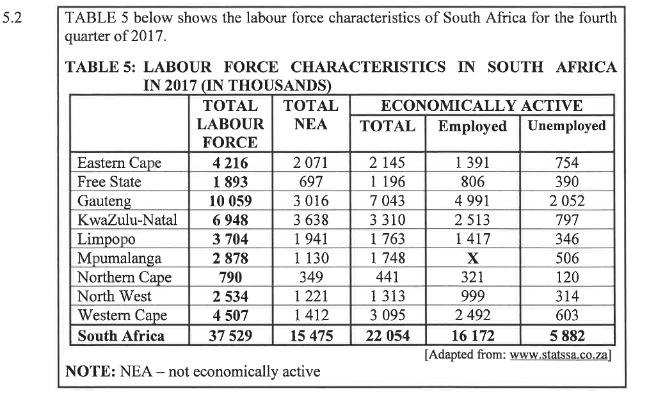
Use TABLE 5 above to answer the questions that follow.
5.2.1 Explain the meaning of the term unemployed within the context of the table above. (2)
5.2.2 Determine the value of X, the number of people employed in Mpumalanga. (2)
5.2.3 Name ONE data collection instrument that could be used to collect the data above. (2)
5.2.4 Calculate the percentage of people in the Western Cape who are NOT economically active (NEA). (3)
5.2.5 Write down the ratio of employed people to unemployed people in South Africa in the form …: 1. (2)
5.2.6 Determine the probability (as a decimal) of randomly selecting a person in the Free State who is NOT economically active (NEA). (2)
5.2.7 The graph on the ANSWER SHEET represents the number of economically active people, as well as those who are not economically active (NEA) in South Africa. The bars for ALL economically active persons and only the bar for the people in the Eastern Cape who are NOT economically active (NEA) are drawn.
Use the ANSWER SHEET to draw the graphs for the rest of the provinces. (6)
5.2.8 Determine the probability, as a simplified fraction, of selecting a province where fewer than 350 000 people are unemployed. (4)
[35]
TOTAL: 150