 Skip to content
 A familiar question among professional tennis players is whether the speed of a tennis serve (in km/h) depends on the height of a player (in metres). The heights of 21 tennis players and the average speed of their serves were recorded during a tournament. The data is represented in the scatter plot below. The least squares regression line is also drawn.
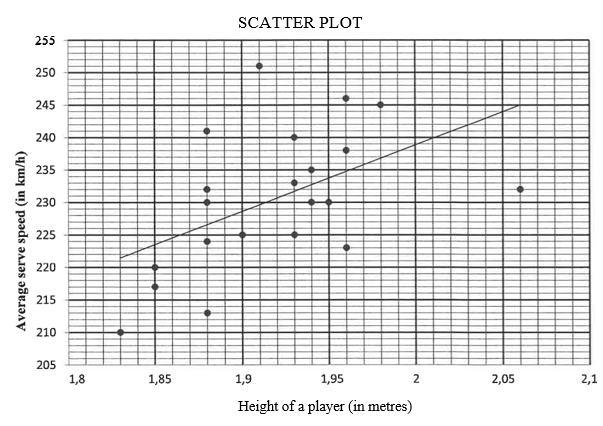
2.1 Write down the fastest average serve speed (in km/h) achieved in this tournament (1)
2.2 Consider the following correlation coefficients:
2.2.1 Which ONE of the given correlation coefficients best fits the plotted data? (1)
2.2.2 Use the scatter plot and least squares regression line to motivate your answer to QUESTION 2.2.1. (1)

2.3 What does the data suggest about the speed of a tennis serve (in km/h) and the height of a player (in metres)? (1)
2.4 The equation of the regression line is given as j’ = 27,07 + bx
Explain why, in this context, the least squares regression line CANNOT intersect the y-axis at (0 ; 27,07). (1)
[5]