The velocity time graph below represents the motion of a girl riding her bicycle in an
easterly direction on a straight, level road.
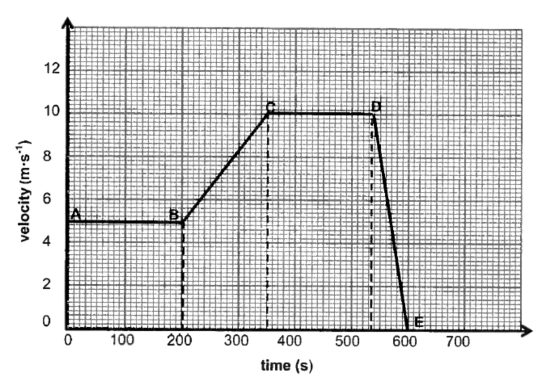
4.1 Write down the:
4.1.1 Girl’s initial velocity (2)
4.1.2 Magnitude of the girl’s velocity at t = 300 s (2)
4.2 Use the information from the graph to describe the girl’s motion:
4.2.1 From B to C (2)
4.2.2 From C to D (2)
4.3 Without using equations of motion, calculate EACH of the following:
4.3.1 Distance covered by the girl from A to C (4)
4.3.2 Acceleration of the girl from D to E (4)
4.4 Give a reason using information from the graph why it can be concluded that
the acceleration of the girl is HIGHEST during the interval D to E. (2)
[18]