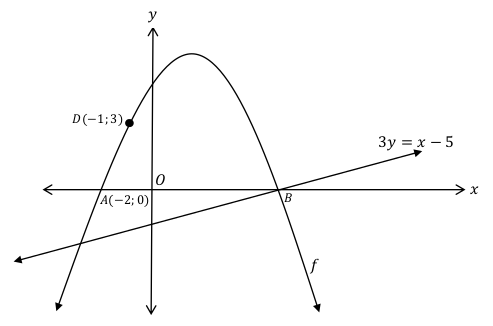
The sketch below shows the graph of the function f(𝑥) = a𝑥2 + b𝑥 +c.
The straight line with equation 3y = 𝑥 – 5 intersects f at B. The points A(-2;0) and B are the 𝑥-intercepts of f . Point D(-1;3)is a point on f .
9.1 Determine the coordinates of B.(2)
9.2 Determine the equation of f .(4)
9.3 Determine the coordinates of the turning point of f .(2)
9.4 Point E is a point on the straight line so that DE is parallel to the y-axis. Determine the length of DE.(3)
9.5 Calculate the average gradient between B and D.(1)
9.6 For which value(s) of 𝑥 is 𝑥 x f (𝑥) ≥ 0?(2)
[14]