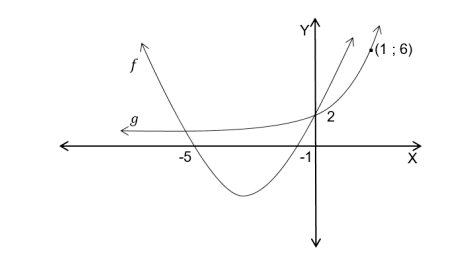
Sketched below are the graphs of f(x) = ax2 + bx + c and g(x) = k. mx. The parabola has intercepts (−5; 0) ; (−1; 0) and (0; 2). The exponential graph passes through the points (0; 2) and (1; 6).
6.1 Determine the equation of the parabola in the form of y = ax2 + bx + c. (4)
6.2 Determine the values of m and k. (3)
6.3 Write down the equation of the asymptote of the exponential curve. (1)
6.4 Determine the value(s) of x for which:
6.4.1 f(x) is decreasing (2)
6.4.2 2 ≤ g(x) ≤ 6 (2)
6.4.3 g(x) ≤ 2 (2)
6.4.4 f(x). g(x) < 0 (2)
6.5 Determine the average gradient between the points (−5; 0) and the y-intercept of g. (3)
[19]