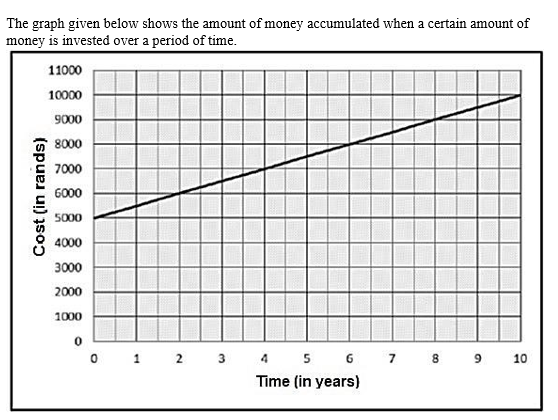
5.1 Name the independent variable. (2)
5.2 Name the type of interest that is illustrated in this graph. (2)
5.3 Explain why the graph is a straight line. (2)
5.4 After how many years is the investment worth double the original value? (2)
5.5 Use the graph to calculate the interest rate per annum. (3)
[11]
TOTAL: [75]