 Skip to content
 5.1 A group of Grade 10 learners were asked what amount of airtime they use in a month.
The results are given in the table below. Refer to the information and answer the
questions that follow.
TABLE 3: RESULTS OF GRADE 10 AIRTIME USAGE SURVEY
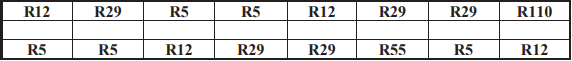
5.1.1 Define the term median. (2)
5.1.2 Determine the mode for the above data. (2)
5.1.3 Calculate the average amount of airtime used by the learners in a month. (3)
5.1.4 Show by means of calculation that the range of this data is R105. (2)
5.1.5 What is the probability that a learner uses R29 airtime in a month?
Give your answer as a decimal fraction, rounded off to three decimal places. (3)
5.2 A survey was conducted where learners were asked what their favourite brand of
sneakers is. The results are shown in the figure below.
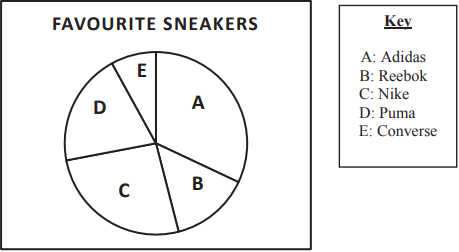
5.2.1 Name the type of graph illustrated above. (2)
5.2.2 Name the THREE most favourite brands of sneakers. (2)
5.2.3 If 300 learners were involved in the survey, and 32% preferred Adidas sneakers,
calculate the number of learners who favoured Adidas. (2)
[18]
TOTAL: 75