TABLE 3 below shows research results done by the United States Department of Agriculture
(USDA) in 2014 and 2016 to determine the kinds and numbers of animals.
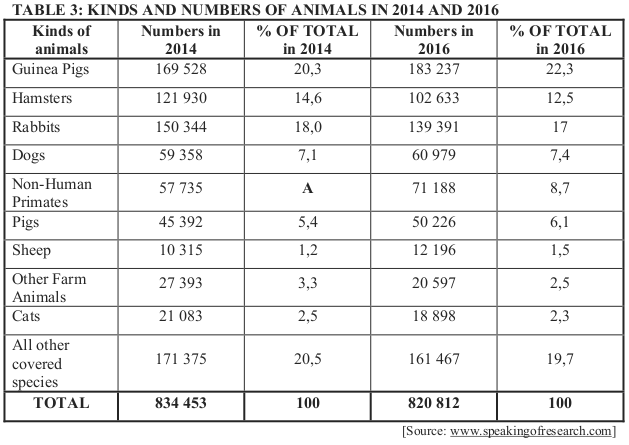
Use the table above to answer the questions that follow.
5.1 Arrange the numbers of animals in 2016 in descending order. (2)
5.2 Determine the median of the numbers of animals in 2016. (3)
5.3 Calculate the difference in percentage (%) of the number of pigs in 2014 and 2016. (2)
5.4 Determine the mean of all types of animals in 2016. (3)
5.5 Calculate the range of the numbers of animals in 2014. (2)
5.6 Determine the value of A, the Non-Human Primates percentage of totals in 2014. (3)
5.7 An incomplete bar graph showing the number of animals during 2016 is drawn on the
ANSWER SHEET. Fill in the remaining bars. (4)
5.8 Determine, as a decimal fraction, the probability of randomly selecting an animal that
will be from any kind of animals with a population less than 50 000 in 2014. (3)
[22]
TOTAL: 100