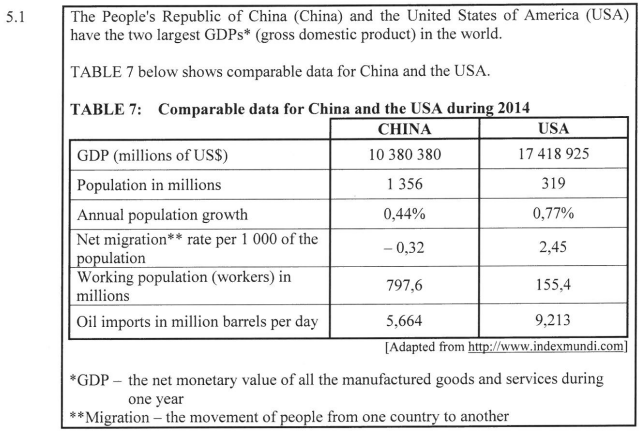
5.1.1 Interpret China’s net migration rate. (2)
5.1.2 Calculate the difference between the projected population sizes of China and the USA at the end of 2015 based on their population growth. (5)
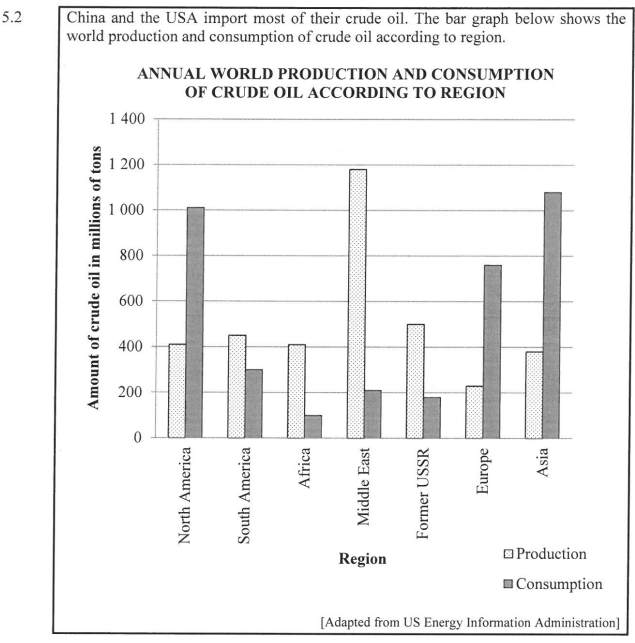
Use the bar graph to answer the following questions.
5.2.1 Name the region that shows the greatest difference between the amount of crude oil they produced and the amount of crude oil they consumed. (2)
5.2.2 Calculate the difference in the production and the consumption of crude oil for both North America and Asia and comment on the difference. (3)
5.2.3 Give ONE possible reason for the high consumption of crude oil in North America and Asia. (2)

Use the information provided in ANNEXURE E to answer the following questions.
5.3.1 Determine the approximate distance, in miles, between the two largest choke points. (3)
5.3.2 30% of all seaborne crude oil passes through the Strait of Hormuz daily.
Calculate the total amount of crude oil transported by ship daily. (3)
5.3.3 Give TWO economic reasons why it is not advisable to transport crude oil around the Cape of Good Hope to Europe. (4)
[24]
Total: 150