
Use the graphs above to answer the following questions.
4.1.1 Show by calculation that one mile is equivalent to 1 760 yards. (2)
4.1.2 Determine the approximate distance (in miles) from the start of the San Francisco Marathon to where the height above sea level rises steeply for the first time. (2)
4.1.3 Calculate the maximum height above sea level (in meters) for the Oakland Marathon. (3)
4.1.4 An Oakland Marathon participant stated that the first 10 miles had been the most difficult, but thereafter it was much easier. Give a possible reason for this participant’s statement. (2)
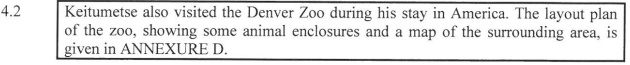
Use ANNEXURE D to answer the following questions.
4.2.1 Determine the total number of venues that are available for services and education. (2)
4.2.2 Keitumetse entered the zoo, passed the predator enclosure and continued walking in a westerly direction. Name the next major animal enclosure that he will encounter. (2)
4.2.3 If the area of the elephant enclosure is approximately the size of the area of four football fields, estimate the area of the entire zoo in terms of the area of football fields. (4)
4.2.4 The shortest distance between York Street and Colorado Street is 1,6km.
Verify (showing ALL calculations) whether the bar scale on the map is correct. (7)
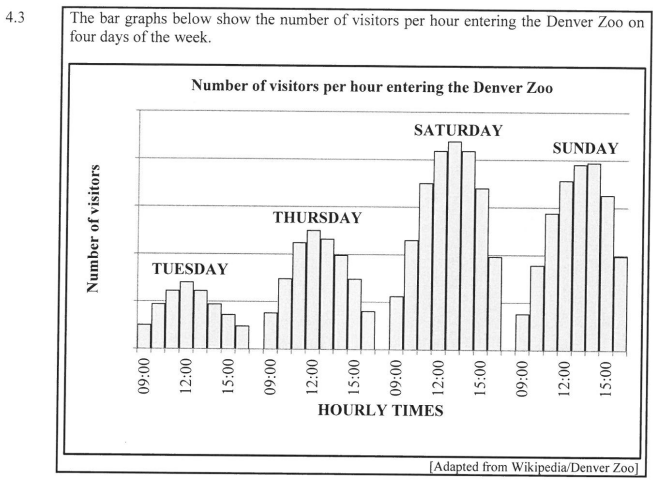
Use the graph above to answer the following questions.
4.3.1 According to the graph, on which day do most people visit the zoo? (2)
4.3.2 Give ONE reason why it cannot be said with certainty that 12:00 on a Monday is NOT a very popular time for visitors to enter the zoo. (2)
4.3.3 Describe TWO possible trends that relate to the number of visitors and the hourly times visitors enter the zoo. (4)
4.3.4 Keitumetse states that at 09:00 on Saturdays the number of visitors entering the gates is nearly double the number of visitors at 09:00 on Tuesdays.
Give TWO reasons to justify this statement.(4)
[36]
Total: 150