A group of learners wrote a standardised English test that was scored out of 60. The results were represented in a cumulative frequency graph below.
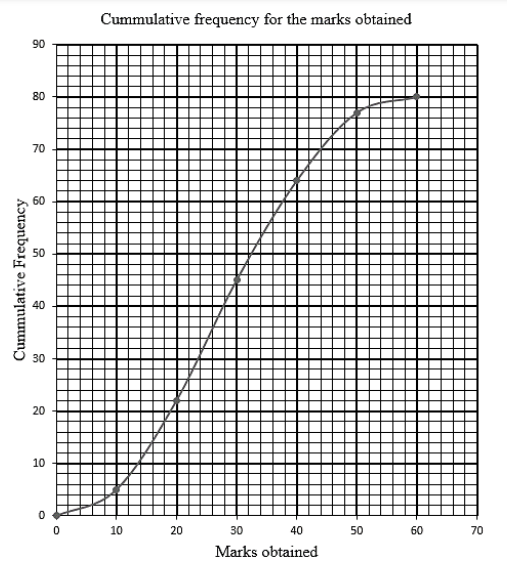
2.1 How many learners wrote the test? (1)
2.2 How many learners scored at least 20 out of 60? (2)
2.3 Using the graph, estimate the median test score. (2)
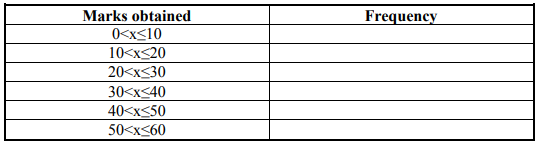
2.4 Complete the frequency table below using the SPECIAL ANSWER BOOK provided. (5)
2.5 Write down the modal group. (1)
[11]