2.1 Two classes wrote a Mathematics test that had a maximum mark of 60. The results of each class are summarised in the box and whisker diagrams below.
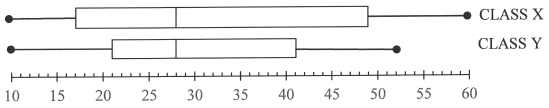
2.1.1 Comment on the skewness of the results in class X. (1)
2.1.2 In which class is the standard deviation of the marks bigger? (1)
2.1.3 Comment on the average perfromance in the test of the two classes. use relevant statistics to support your argument.
2.2 The time, in minutes, that it took for the first goal to be scored in seven football games was recorded. The times, in ascending orde, are represented by a, b, c, d, e, f and g in the table below.

The following obsservations were made about the data:
- All these goals were scored at different times.
- The minimum time for the first goal was 5 minutes.
- The range of the times was 48 minutes.
- The median time was 22 minutes.
- The differences between the time at the lower quartile and the minimum time was 7 minutes.
- The IQR of the times was 28 minutes.
- The meadian time was 27 minutes.
- e = 2c
2.2.1 Determine the values of a, b, c ,d, e,f and g. (8)
2.2.2 If the standard deviation of the data set is 15.87 minutes, how many goals were scored within ONE standard deviation of the mean time? (3)
[15]