11.1 The Venn-diagram below shows two independent events, M and N.
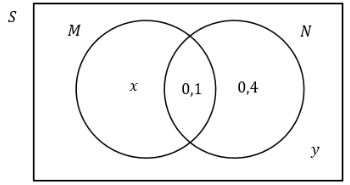
Determine the values of probabilities x and y. Show all calculations.(5)
11.2 The following contingency table shows information on the drivers’ tests of 100 drivers tested at a test centre in Port Elizabeth.
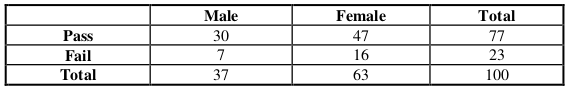
A driver is randomly selected from the 100 drivers.
11.2.1 Determine the probability that a female that failed is selected.(2)
11.2.2 Determine the probability that the driver passed, given it is a male.(2)
11.3 William writes a Mathematics examination and an Accounting examination.
He estimates that he has a 40% chance of passing the Mathematics examination.
He estimates that he has a 60% chance of passing the Accounting examination.
He estimates that he has a 30% chance of passing both.
Determine the probability that William will fail Mathematics and Accounting.(3)
[12]
TOTAL: 150