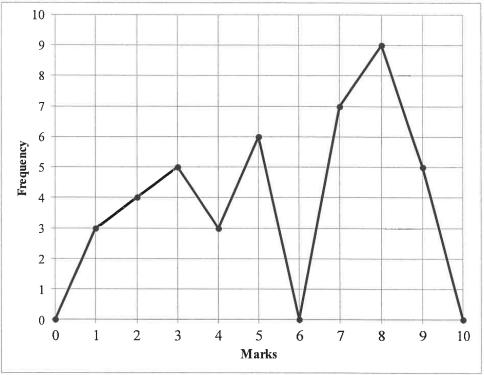
The line graph below shows test marks out of 10 obtained by a Grade 10 class.
1.1 Complete the frequency column in the table provided in the ANSWER BOOK. (2)
1.2 How many learners wrote the test? (1)
1.3 Calculate the:
1.3.1 Range for the data (2)
1.3.2 Mean for the test (3)
1.4 Determine the median for the data. (3)
1.5 Draw a box and whisker diagram for the data. (3)
[14]