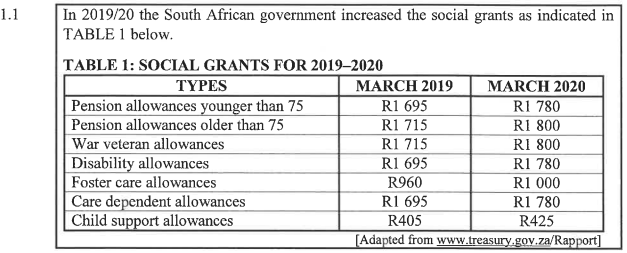
Use TABLE 1 above to answer the questions that follow.
1.1.1 Is the type of data in TABLE 1 numerical data or categorical data? (2)
1.1.2 Identify the modal allowance amount for March 2020. (2)
1.1.3 Arrange the social grants for March 2019 in descending order of value. (2)
1.1.4 Determine (in rand) the increase in the disability allowances for March 2020. (2)
1.1.5 Write down the type(s) of allowances which represents the highest amount
in March 2020. (2)

Use the information above to answer the questions that follow.
1.2.1 Convert 400 g to kg. (2)
1.2.2 Determine the profit she will make if she sells a can of Hot and Spicy Chakalaka. (2)
1.2.3 She buys a 2,5 kg pack of white sugar and repacks the sugar into 250 g packets.
Determine how many packets she will be able to get from ONE pack of
2,5 kg sugar. (3)
1.2.4 The 2 kg Tastic rice is divided into 8 smaller packets.
Calculate the selling price of ONE small packet. (2)
1.3 Candidates sat for the National Senior Certificate examinations in November 2018.
The box-and-whisker plot below shows the five-number summary of the average pass
percentages for Mathematical Literacy.
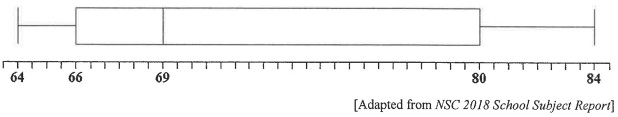
Use the box-and-whisker plot above to answer the questions that follow.
1.3.1 Write down the pass percentage that represents the following:
(a) The median (2)
(b) Quartile 3 (2)
1.3.2 Determine the difference between the highest and the lowest pass percentage (2)
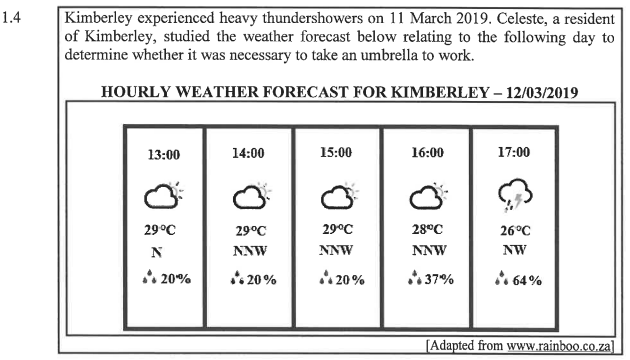
Use the information above to answer the questions that follow.
1.4.1 At what time of the day is the temperature expected to be 28 C (2)
1.4.2 Determine the probability that it will rain when Celeste leaves work
at 2:30 p.m. (2)
[30]