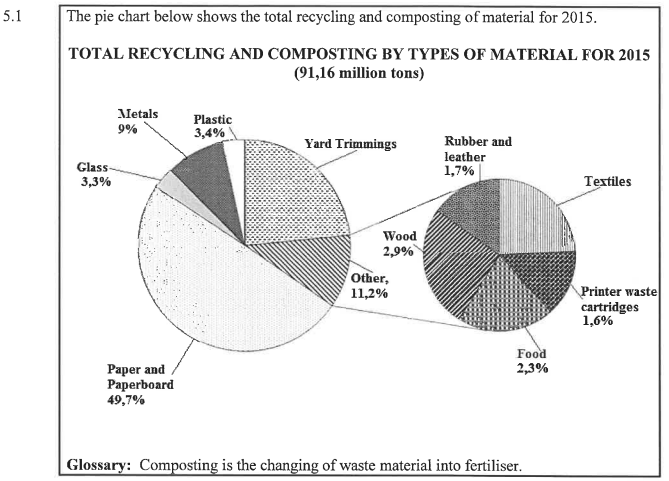
Study the pie charts above and answer the questions that follow.
5.1.1 Write down ONE possible data collection method that was used to gather
the above data. (2)
5.1.2 Calculate the percentage allocated for yard trimmings. (3)
5.1.3 Determine the percentage allocated for textiles. (2)
5.1.4 Calculate (in tons) the total amount of plastic recycled in 2015. (3)
5.1.5 Give ONE possible example of a product that could be recycled under the
metals category. (2)
5.1.6 State another type of graph that could be used to represent the data above. (2)
5.1.7 Determine, as a decimal, the probability of randomly selecting a material in
the ‘other’ category that is NOT textiles. (4)

Use TABLE 5 to answer the questions that follow.
5.2.1 State the number of KZN delegates in the NCOP. (2)
5.2.2 Write down (in simplified form) the ratio of the total number of permanent
seats to special seats for the ANC in the NCOP. (3)
5.2.3 Identify ONE party that has NO permanent seat in the NCOP. (2)
5.2.4 An incomplete bar graph showing the different type of delegates
representing each party in the NCOP, is drawn on the ANSWER SHEET.
On the same ANSWER SHEET complete the bar graph for the Democratic
Alliance (DA). (3)
[28]
TOTAL: 150