Study the information in ANNEXURE C to answer the questions that follow.
5.1.1 Name another type of graphical representation that could be used to represent this data. (2)
5.1.2 Determine the maximum number of candidates who were admitted as full-time candidates in 2016. (2)
5.1.3 Determine the probability of randomly selecting a candidate, taking Mathematics or Mathematical Literacy, who was admitted in 2015. (2)
5.1.4 List ALL the subjects that showed a decrease in the number of full-time candidates admitted from 2015 to 2016. (3)
5.1.5 Name the subject that showed the greatest increase in the number of candidates admitted in 2016. (2)
5.1.6 Explain why this is called categorical data. (2)
5.1.7 Identify which subject in 2016 had more than two hundred twenty three thousand, but less than two hundred seventy four thousand candidates. (2)
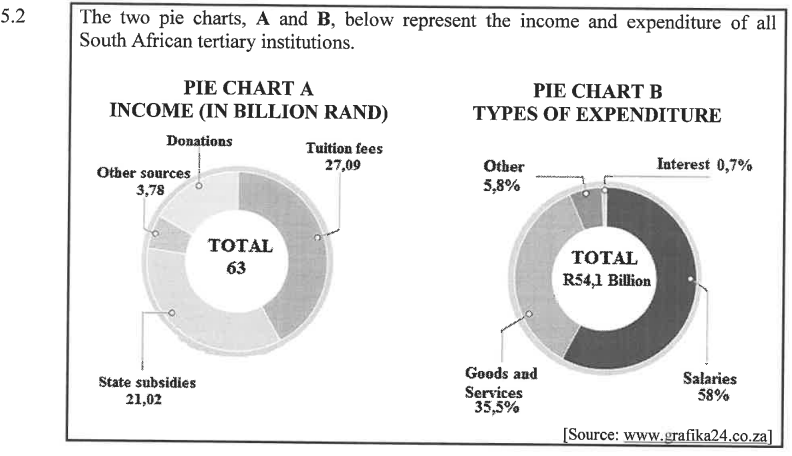
5.2.1 Give ONE example of an ‘Other’ type of expenditure applicable to tertiary institutions. (2)
5.2.2 What percentage of income comes from donations? (3)
5.2.3 Calculate the amount (in rand) of interest paid by tertiary institutions. (3)
5.2.4 Determine the difference in millions of rand) between the income and expenditure of the tertiary institutions. (3)
[26]
TOTAL: 150