Mrs Base, a Mathematical Literacy teacher at Zinako High School, recorded the results of her
Grade 10 learners in the final examination as a percentage, as shown below.
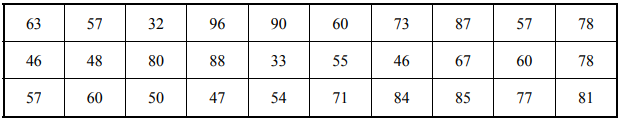
4.1 4.1.1 Calculate the average mark of the Grade10 Mathematical Literacy learners in
the final examination. (3)
4.1.2 Mrs Base claims that the mode of the data will be 78%. Explain what the mode
is and verify whether her statement is valid or not. (3)
4.2 Mrs Base’s learners’ performance in the examination are summarised in the table
below:
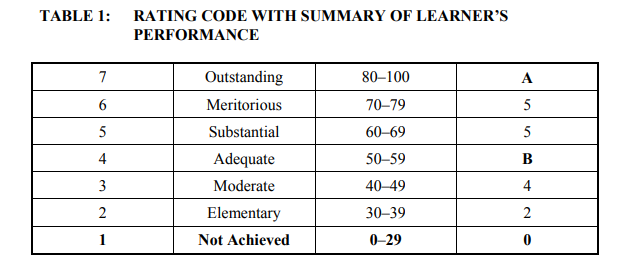
4.2.1 Determine the values of A and B. (2)
4.2.2 What is the probability that a learner from Mrs Base’s Mathematical Literacy
class scored less than 60% in final examinations? Write your answer as a
percentage. (2)
4.3 Study the pie charts below that show the Amathole District municipality’s service
delivery for a particular period. The number of households for this particular period is
324 292. Answer the questions that follow.

Refer to the pie chart above to answer the questions below.
4.3.1 Determine the missing value of A and calculate how many semi-detached houses
are in the Amathole District Municipality. (4)
4.3.2 Determine the number of households which has flush toilets. (3)
4.3.3 Write down the percentage of shacks as a ratio to the number of ‘other’. (2)
4.3.4 Give an example of the type of housing referred to as ‘other’ in the pie chart
above. (2)
[21]
TOTAL: 75