The siren of a police car, which is travelling at a constant speed along a straight horizontal road, emits sound waves of constant frequency. Detector P is placed inside the police car and detector Q is placed next to the road at a certain distance away from the car. The two detectors record the changes in the air pressure readings caused by the sound waves emitted by the siren as a function of time.
The graphs below were obtained from the recorded results.
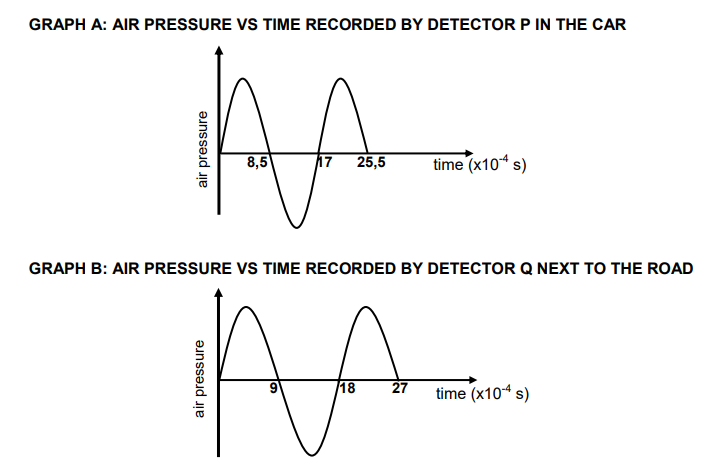
6.1 Different patterns are shown above for the same sound wave emitted by the siren. What phenomenon is illustrated by the two detectors showing the different patterns? (1)
The police car is moving AWAY from detector Q.
6.2 Use the graphs and give a reason why it can be confirmed that the police car
is moving away from detector Q. (1)
6.3 Calculate the frequency of the sound waves recorded by detector P. (3)
6.4 Use the information in the graphs to calculate the speed of the police car.
Take the speed of sound in air as 340 m∙s-1. (6)
[11]