Use the data above to answer the questions that follow.
4.1.1 Determine the percentage increase in the total number of households from 2001 to 2011. (4)
4.1.2 State which household size matches EACH of the following trends:
(a) Increased every year, but only by a small percentage (2)
(b) Remained constant in every census from 1996 to 2011 (2)
4.1.3 It was stated that the percentage of households with five or more persons decreased from 2001 to 2011, therefore the number of households with five or more persons decreased by 0,060 million.
Verify, showing ALL calculations, whether this statement is CORRECT. (5)
4.1.4 Explain why the percentages for the 1996 census do not add up to 100%. (2)
4.1.5 Write down the probability of randomly choosing a household from the 2011 census with a household size fewer than four persons. (3)
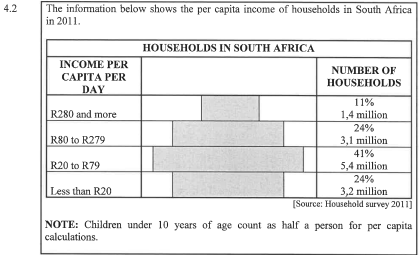
4.2.1 Write down the modal class for the income per capita per day (2)
4.2.2 Determine the total number of households with a per capita income of less than R80 per day. (2)
4.2.3 The Wong Family has the following income per person:
- Mr Wong: R276 000 per year
- Mrs Wong: R541 500 per year
Calculate the Wong household income per capita per day if they have 2 children, aged 15 and 8 years old.
You may use the formula:
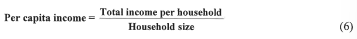
4.2.4 A household with an income of R280 per capita per day spends 4% of their income on cellphones.
Determine the total amount spent by this household on cellphones per year. (3)