1.1 Mr Brown conducted a survey on the amount of airtime (in rands) EACH students had on his or her cellphone . He summarized the data in the box and whisker diagram below.
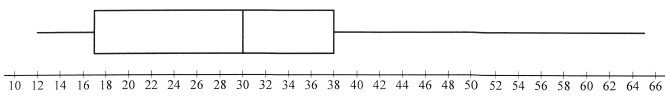
1.1.1 Write down the five -number summary of the data.
(2)
1.1.2 Determine the interquartile range.
(2)
1.1.3 Comment on the skewness of the data
(1)
1.2 A group of 13 students indicated how long it took (in hours) before their cellphone batteries required recharging. The information is given below.

1.2.1 Calculate the value of y if the mean of this data set is 41.
(2)
1.2.2 If y=94, calculate the standard deviation of the data.
(1)
1.2.3 The mean time before another group of 6 students needed to recharge the batteries of their cellphone was 18 hours. Combine these groups and calculate the overall mean time needed for these two groups to recharge their cellphone batteries.
(3)
[10]